In layer four there was a spike between pixel values 12 and 18. This was on the left side of the histogram, and from the module I knew this would mean a dark area of the image. From the image it appeared this may be deep water. Using the search cursor I verified that there was a correlation between pixels in the histogram and the area I had selected on the image. Once this was done I used the Inquire box and the Subset & Chip tool to select an area that best depicted this feature in the image and saved this as new file. I then opened the file in ArcMap and created the map above.
In layers 1-4 there was a small spike around pixel value 200 and a large spike between pixel values 9 and 11 in layers 5 and 6. This was on the right side of the histogram, and from the module I knew this would mean a very light area of the image. From the image it appeared this may be the snowcapped mountains. Using the search cursor I verified that there was a correlation between pixels in the histogram and the area I had selected on the image. Once this was done I used the Inquire box and the Subset & Chip tool to select an area that best depicted this feature in the image and saved this as a new file. I then opened the file in ArcMap and created the map above.

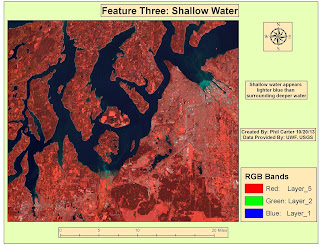
In certain areas of the water, layers 1-3 are much
lighter than normal. Layer 4 was a
little brighter and layers 5 and 6 were unchanged. From the image it appeared
this may be several areas of shallow water. Using the search cursor I verified
that there was a correlation between pixels in the histogram and the area I had
selected on the image. Once this was
done I used the Inquire box and the Subset & Chip tool to select an area
that best depicted this feature in the image and saved this as a new file. I then opened the file in ArcMap and created the map above.


No comments:
Post a Comment