Thursday, July 25, 2013

GIS Programming - Participation Assignment II

GIS as a Tool in Participatory Natural Resource Management

As the title states this article is about participatory GIS being used a tool in the management of natural resources.  Although the article is ten years old, as a natural resource manager, I still found it interesting and relevant.  The article covers a study of three areas in Peru where local farmers, Non-governmental organizations (NGOs), and GIS professional worked together to analyze data, and produce information that could be easily used to  best manage resources for farming and the grazing of animals.   This particular article covers many of the pros and cons concerning the use of participatory GIS in natural resource management.   It brings to light many of the factors that need to be addressed such as who are the stakeholders, how will participatory GIS help each of them, and what do these stakeholders bring to the table.   Other things addressed in the article I found useful were deciding what data was to be used, was the data already available or did it need to be collect, if so, how would the data be collected and by whom.   Once the data was collected and analyzed the article touched on the issue of what output or end product did the stakeholders require or want.  In this case map covering larger areas, or as referred to in the article as catchments, were useful for management of resources on a larger scale, however many of the stakeholders in the article needed a deliverable of smaller scale such as parcel level.  Unfortunately, as in the case many times, data on the parcel scale turned out to be complex to provide and costly.   I have considered investing time and resources in such a project myself and having read this article feel I have a better understanding of the process involved.

Link:

Module 9 Debugging and Error Handling


The above screen shots are the results of 2 scripts I was given in my GIS Programming course. The scripts provided, each had a number of errors to be corrected before they would run and print the results shown in the screen shots. The method I used to locate the problems was trail and error.  Frist checking for syntax errors, and once all of those were corrected, I would attempt to run the script. I would interpret the message in the interactive window correct the error and attempt to run the script again. This method was repeated until the script ran successfully and printed the above messages.

Thursday, July 18, 2013

Module 7 Geometry and Rasters


The screen Shots above were created for my GIS Programming course.  For this module we were to write two scripts, in the first script we were to create a ".txt" file and then write to it coordinates and Object IDs for vertices in a shapefile. In the second script we created a raster output that identified areas that fell within certain parameters, in this case, slope between 5 and 20 degrees and aspect between 150 and 270 degrees. Once this was completed the output was saved.

Location Decisions


The three maps above were created for my GIS Applications course.  We were to assist a couple find a home in Alachua County Florida. To assist us we were given the following criteria; close to the University of Florida, and North Florida Regional Medical Center, neighborhoods with a high percentage of home ownership, and neighborhoods where the majority of the population were ages 40 to 49. The first map is a base map of Alachua County. It is for reference showing major roads, cities, and a few other features. The second map depicts four separate views of Alachua county each one showing the different criteria used in selecting a home location. The final map depicts the selection criteria when weighted. The frame on the left shows all criteria equally weighted (25%) the map on the right shows the criteria weighted using 40% for commuting purposes and 10% for homeownership and population 40 - 49 years of age.

Saturday, July 13, 2013

GIS for Local Government


I created the above maps for my GIS Applications course. The first map is a screen shot saved as a jpeg file. This was retrieved from the Marion County, Florida property appraiser's website.  The Marion County property appraiser's  website appears to be more robust than many other property appraisers sites I have visited.  The second map is a site map of the same parcel. It includes a table which list surrounding parcels, their size and zoning.  The final map depicts two parcels of land owned by Gulf County Florida. The map shows the general location of the parcels and includes a close view of each parcel this is provided so the county can better decide on which parcel to build a new extension Office.

Thursday, July 11, 2013

GIS Applications Participation Assignment

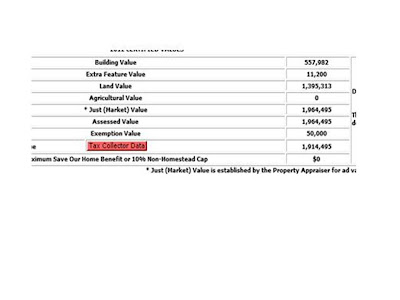
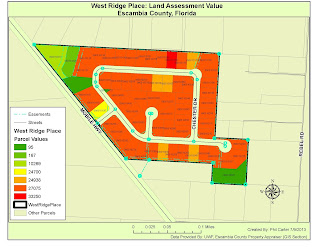
For my GIS Applications course we were given an assignment with two parts the first was to research our local property appraisal services, and answer four questions, which I have done below.  For the second part of the assignment we were task with creating a map depicting assessed property values for the West Ridge Place subdivision located in Escambia county, Florida, and decide if some of these values need to be reviewed.


Question 1.  The web address for the Okaloosa, FL property appraisers mapping site is as follows:


Question 2. The highest price paid for a property in Okaloosa County for June of 2013 was 2.7 Million Dollars.     The previous selling price appears to be $100.00.


Question 3. The assessed land value for this property is 1,395,313 dollars. Which is lower than the last selling price.


Question 4. I found it interesting that this property which just sold for 2.7 million dollars shows a previous sale price of $100.00.


Question 5. Most parcels fall in a price range between 24,000 and 27,000 dollars. There are some that list for much less but these are not available for development i.e. retention ponds, sewage lift station, and a conservation easement.  However one parcel (0903101165) list for over 33,000 dollars, it appears to be similar in size and location to the other parcels.  That being said this parcel should be reviewed.


Friday, July 5, 2013

Module 6 Explore/Manipulate Spatial Data

The above screen shot is the results of the script I wrote for module 6 of my GIS Programming course. In this script we created a geodatabase and populated it with several shape files. We then created a dictionary and populated the dictionary with names and populations of county seats from an existing "cities" shape file.  Oddly enough I found the hardest part was not getting the script to work but getting it to print the above messages!

Home Land Security Week Two


Above are three maps I created for my GIS Applications course. This is the second week we have worked in the area of Homeland Security. The first map depicts the finish line of the Boston Marathon and all hospitals within a three mile radius. The second map depicts check points at all egress and ingress points 500  feet from the Boston Marathon finish line.  The final map depicts several proposed surveillance points and their line of sight to the finish line it all so shows the ground shaded areas around the finish line at 1430 on 15 April 2013.